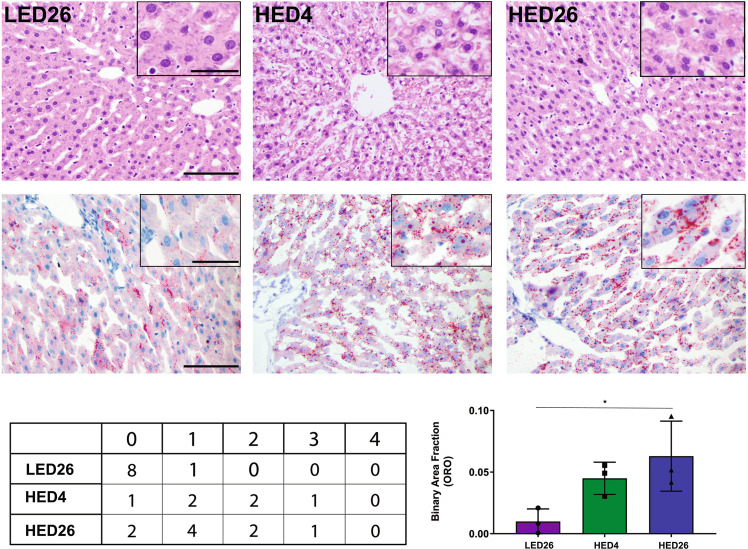
Fig. 5. hED diet intake induces hepatic lipidosis.
Representative histopathological images of hematoxylin and eosin stained (top row) and oil-red-o stained (bottom row) hepatic tissue from rats fed a LED diet (left column), rats fed a HED for 4 weeks (middle column), and rats fed a HED for 26 weeks (right column), n = 3 for each group. H&E staining revealed an increase in distinct vacuoles in rats fed the HED diet (HED4 and HED26) compared to LED controls (LED26) (top row). Similarly, ORO staining showed that HED-fed animals exhibited more intensely red granules (HED4 and HED26) than LED controls (LED26) (bottom row). The quantitative scoring (Table) confirmed that hepatocellular lipidosis is apparent after consuming a HED diet for four weeks. We did not observe significant differences in the extent of hepatocellular lipidosis between the ST-HED (HED4) and LT-HED (HED26) groups. LED fed rats did not show signs of hepatocellular lipidosis. Graph represents mean ± SD binary analysis of the area fraction of ORO staining, which further confirms our results. Asterisk indicates statistical significance *P < 0.05.

