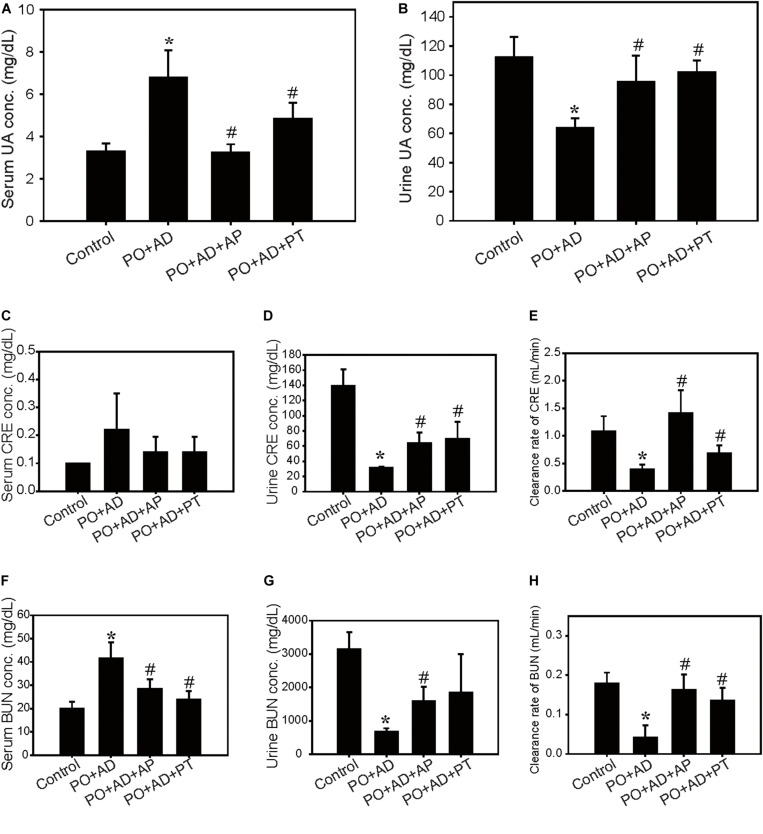
FIGURE 3.
Improvement of renal function by PT in the CKD model. Serum and urine levels of UA (A,B), creatinine (CRE; C,D), blood urea nitrogen (BUN; F,G), and clearance rate of CRE (E), and BUN (H) in the CKD model. Data were expressed as mean ± SD of 5 mice per group. *p < 0.05 compared with the control groups. #p < 0.05 compared with PO + AD groups.

