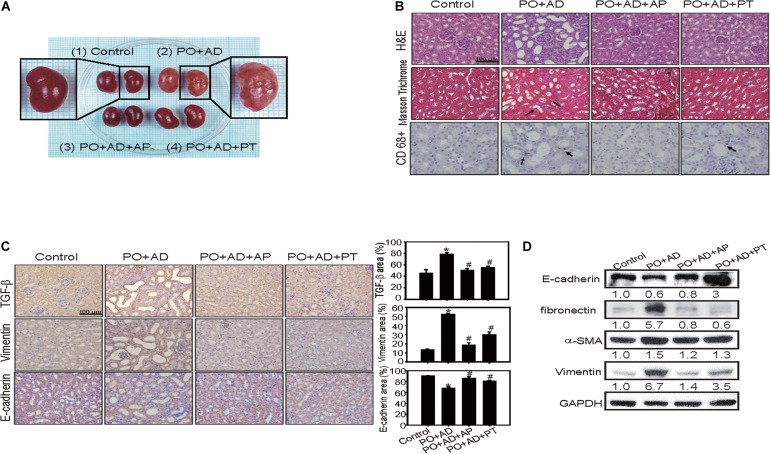
FIGURE 4.
PT alleviates inflammation and interstitial fibrosis in kidney tissues in the CKD model. (A) The size of kidney was increased in PO + AD groups. The appearance of kidney in PO + AD groups was rough and pale. (B) Renal tubular injury was assessed by H&E staining. The deposition of fibrosis in renal tissues was determined by Masson Trichrome staining. Blue color represents collagen fibers, red color represents muscle fibers. Infiltration of macrophages was detected by CD68 staining (brown color, arrow indicated). (C) Tubulointerstitial inflammation and EMT was assessed by staining of TGF-β, Vimentin, and E-cadherin. The results of immunohistochemistry were quantified by ImagJ (n = 3). Bar = 100 μm. *p < 0.05 compared with the control groups. #p < 0.05 compared with PO + AD groups. (D) Compared with PO + AD groups, PT increased the expression of E-cadherin, and decreased the expression of fibronectin, α-SMA, and Vimentin in renal tissues detected by Western blotting analysis. GAPDH was used as an internal control. Representative data from one of three independent experiments are shown. The number below each line indicates the relative intensity of protein expression compared to the control (defined as 1; Figures 4–7).

