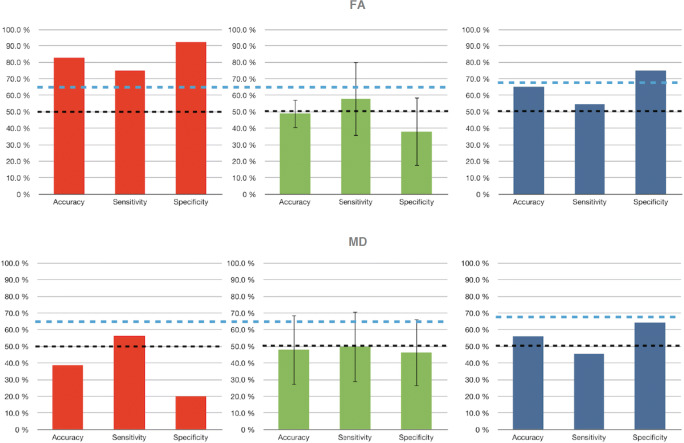
Fig. 2.
FA and MD changes in classification performance. Left, Post–Pre2 classification (red). Center, label permutations of the treatment effect classification (green). Test statistic was compared with the distribution of permutation values, which are computed similarly to the test statistic but under a random rearrangement of the labels of the data set. Right, Pre2–Pre1 classification (blue). The dotted black line indicates the 50% chance level; the dotted blue line indicates the level in which classification accuracy is considered statistically significant based on binomial test. Y-axis, percentage of correct classification

