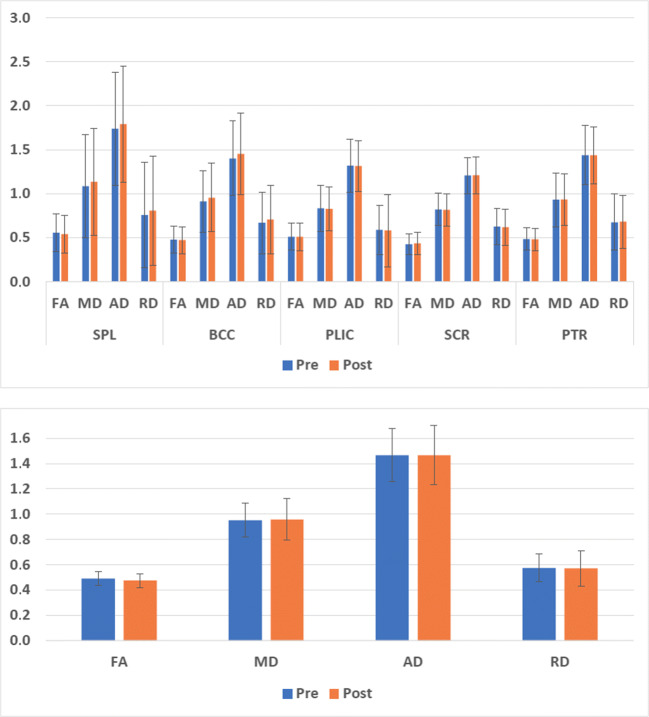
Fig. 4.
Top, Pre- and post-training values of FA, MD, AD, and RD (mean ± SD) in the splenium and body of the corpus callosum and in the contralesional posterior limb of the internal capsule, posterior thalamic radiation, and superior corona radiata. Bottom, FA, MD, AD, and RD values (mean ± SD) averaged over all the regions

