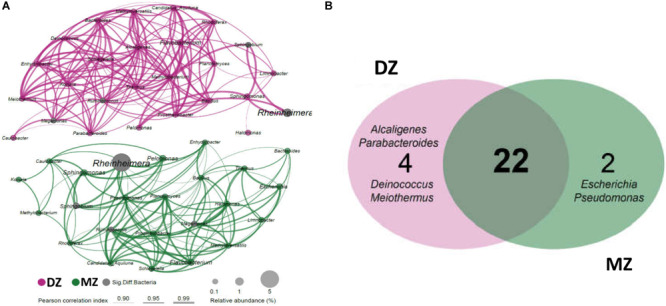
FIGURE 4.

Bacterial co-occurrence networks of DZ and MZ pairs. (A) Each node in the network indicates a bacterial genus. Node size represents the average relative abundance of one genus in each twins group. The thickness of edges represents the correlation value. Only the bacterial connections (edges) larger than cut-offs (correlation value r > 0.9, p < 0.05) were shown. (B) Shared and unique genera between networks of the two groups. Twenty-two genera present in at least 50% of all samples of each group were shared by the two groups, and 2 and 4 genera were unique in MZ and DZ pairs, respectively.
