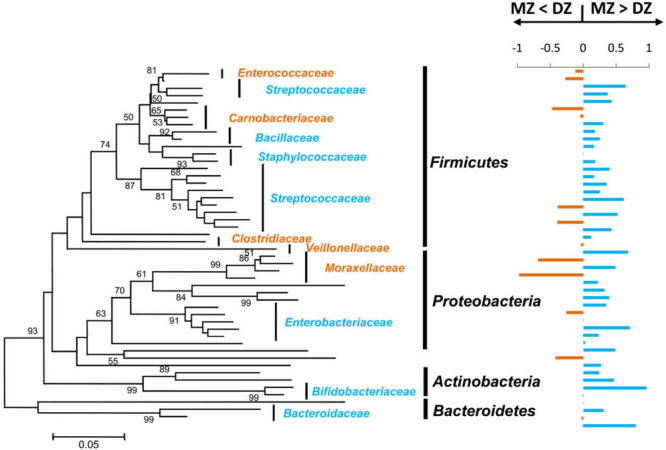
FIGURE 5.

Operational taxonomic units relative abundances correlated within MZ and DZ twin pairs. On the left is a neighbor-joining phylogenetic tree of OTU shared by >50% of the samples in this study. Major bacterial families that the OTUs were classified into were labeled. Bootstrap values > 50% were shown and the bar shows 5% difference in the nucleotide sequence. On the right are corresponding twin-pair intraclass correlation coefficients (ICCs). For each of the OTUs, ICCs were calculated and compared between DZ and MZ. Bars that point to the right represent that the difference is positive (i.e., MZ ICCs > DZ ICCs), colored in blue, and bars that point to the left represent negative differences (i.e., DZ ICCs > MZ ICCs), colored in orange. The families were colored in accordance with the bars.
