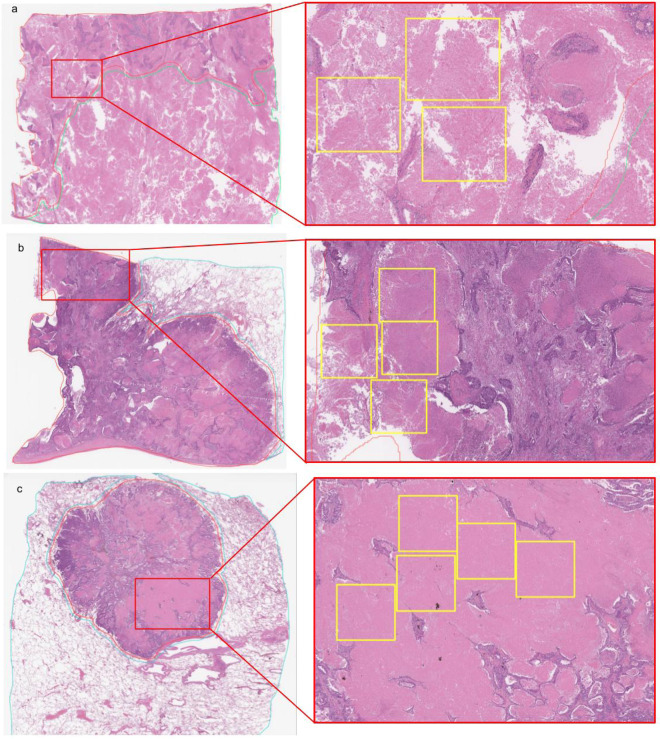
Figure 1.
(a–c) Highlights showing three examples of carcinoma WSI annotations. The left column shows thumbnails of the WSIs, while the right shows zoomed-in crops from regions labelled as carcinoma. The yellow boxes indicate necrotic tissues within the tumour. Extracting tiles from tissue within yellow boxes would result in tiles consisting of necrotic tissue labelled as carcinoma. This would introduce noise within the dataset as necrotic tissue can also be part of non-neoplastic lesions.

