
FIGURE 7.
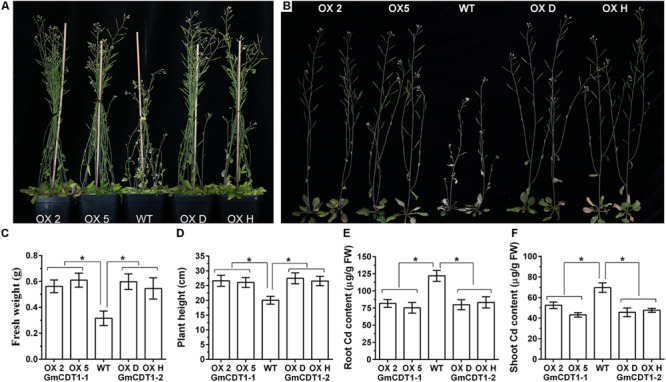
The overexpression Arabidopsis thaliana lines of GmCDT1-1 or GmCDT1-2 showed tolerance to Cd stress. (A,B) Phenotypes of A. thaliana transgenic lines and wild type (WT) after Cd treatment. (C–F) Fresh weight (C), plant height (D), root (E), and shoot (F) Cd content of the WT and transgenic lines. The experiment was performed with at least three independent biological replicates. Significant differences according to the one-way analysis of variance are denoted as follows: *p < 0.01.