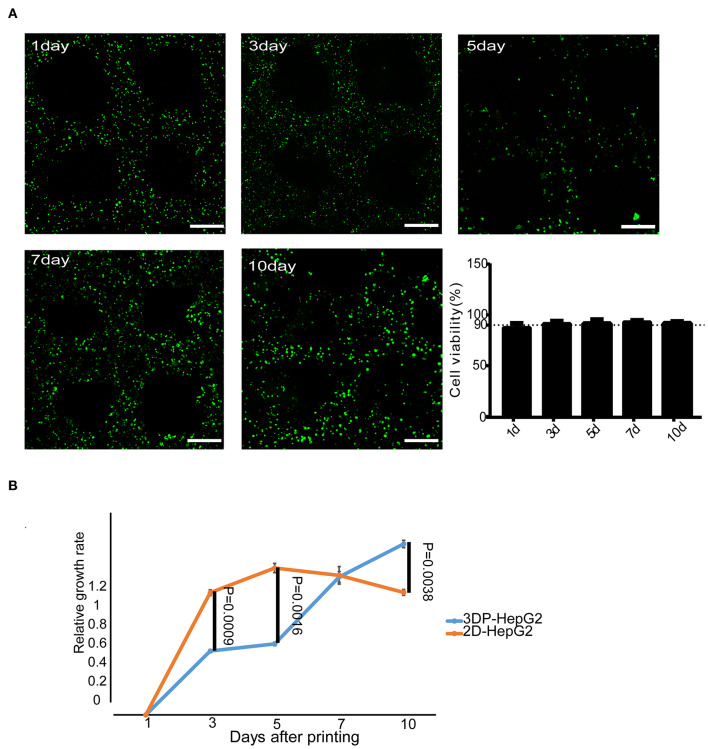
Figure 2.
Cell survival and proliferation in the 3D bioprinted liver cancer cell model. (A) Cell viability at different times after printing. Representative live-dead staining images of 3DP-HepG2 structures at days 1, 3, 5, 7, and 10 after printing. Live and dead cells were labeled with calcein-AM (green) and PI (red), respectively. Scale bar: 300 μm. Histogram of cell viability at different times after printing (B) Proliferation rates of 3DP-HepG2 and 2D-HepG2 cells at different time points.

