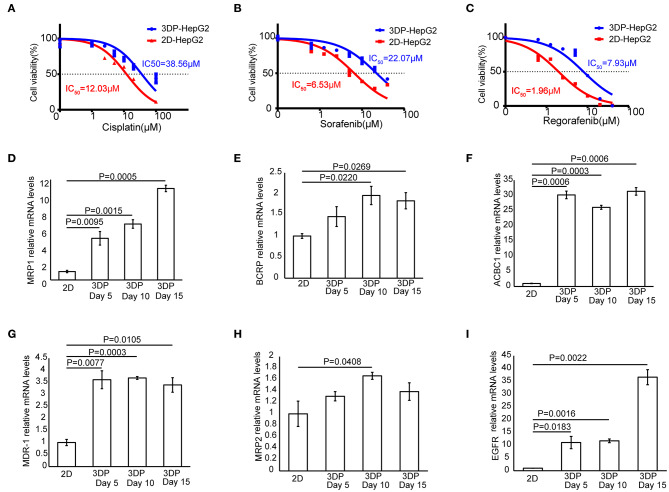
Figure 6.
Characteristics of drug metabolism in the 3D bioprinted liver cancer cell model. Dose-effect curves of cisplatin (A), sorafenib (B), and regorafenib (C) in the 3DP-HepG2 and 2D-HepG2 models after 72 h of treatment. The mRNA expression of drug resistance genes in the 2D-HepG2 and 3DP-HepG2 models at 5, 10, and 15 days after 3D printing. (D) MRP1, (E) BCRP, (F) ACBC1, (G) MDR-1, (H) MRP2, and (I) EGFR mRNAs.

