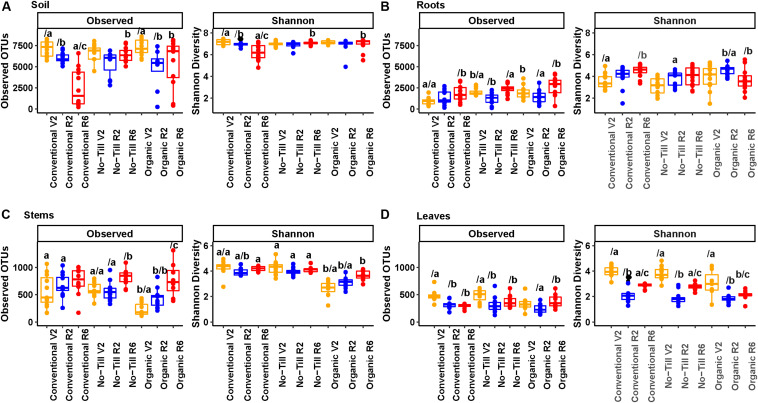
FIGURE 4.
Alpha diversity boxplots showing OTU richness and Shannon diversity metrics for prokaryotic communities, (A) present in soil samples, (B) present in soybean root samples, (C) present in soybean stem samples, and (D) present in soybean leaf samples. Colors represent the plant growth stage during sampling (V2 – two sets of unfolded trifoliate leaves, R2 – full flower reproductive stage, and R6 – full pod development). Significance groups are represented by letters above the boxes. The letter before the forward slash (/) represents significance groups within a single growth stage by management system. Letters following the forward slash (/) represent significance groups within a single management system by growth stage. Significance groups were calculated using Kruskal Wallis tests followed by Pairwise Wilcox tests with a FDR P-value correction.

