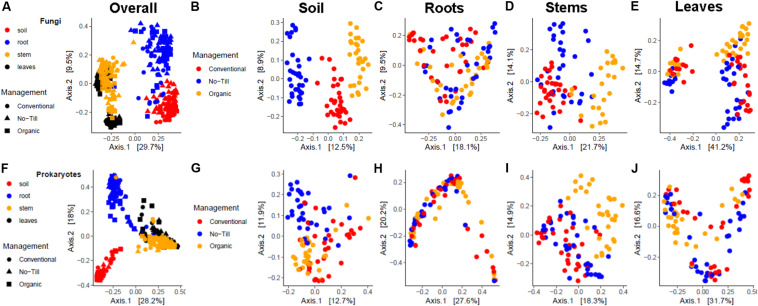
FIGURE 5.
Principal coordinates analysis plots, based on Bray-Curtis dissimilarity, of fungal communities, (A) associated with soybean soil, root, stem, and leaf samples, (B) associated with soil samples, (C) associated with root samples, (D) associated with stem samples, (E) associated with leaf samples and prokaryotic, (F) associated with soil, root, stem, and leaf samples, (G) associated with soil samples, (H) associated with root samples, (I) associated with stem samples, and (J) associated with leaf samples. The shape represents the management system, while color represents sample origin in (A,F). In all others the color represents the management system.

