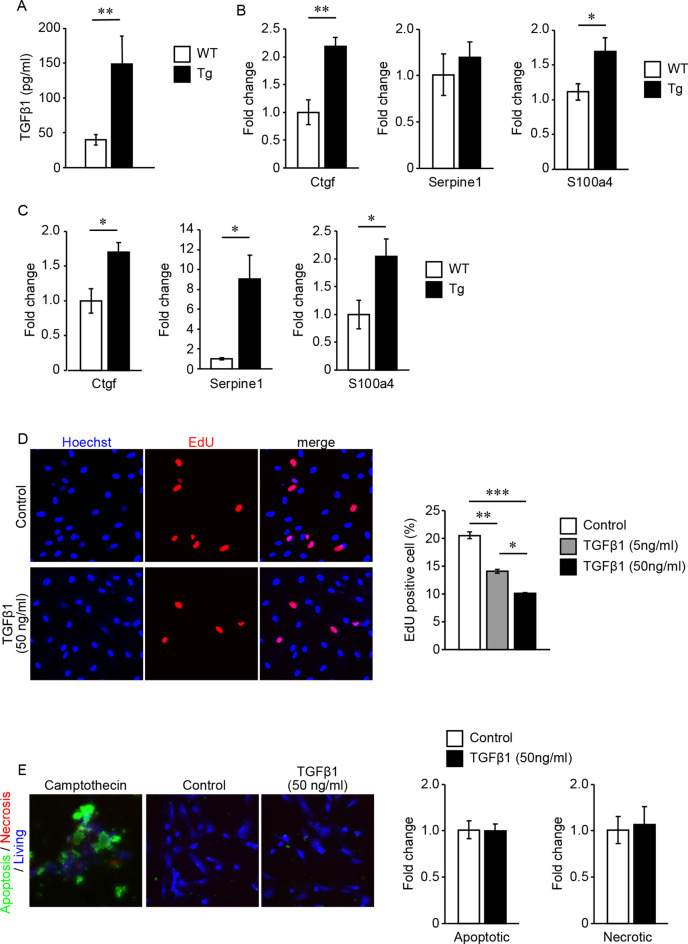
Figure 4.
(A–C) Quantification of TGFβ1 content in the cerebrospinal fluid (CSF) and gene expression levels regulated by TGFβ1 signaling. (A) TGFβ1 content in the CSF of 7-month-old TGFβ1 Tg mice and WT mice. **P < 0.01 according to the Mann-Whitney U-test (n = 3 animals per group). (B,C) Gene expression levels regulated by TGFβ1 signaling in pial arteries (B) and brain capillaries (C) of 7-month-old TGFβ1 Tg mice and WT mice. *P < 0.05 and **P < 0.01 according to a two-tailed unpaired t-test (n = 5 animals per group). (D) Cell proliferation rate under treatment with vehicle or recombinant TGFβ1 was detected by an EdU incorporation assay. Representative images of vehicle- (4 mM HCl with 2% BSA) or 50 ng/ml recombinant TGFβ1-treated cells are shown. Recombinant TGFβ1 repressed the proliferation rate of cerebrovascular SMCs in a dose-dependent manner (n = 5 independent experiments). (E) Cerebrovascular SMCs treated with recombinant TGFβ1 or camptothecin (6 μM). Inducible apoptotic, necrotic, and living cells were detected by a phosphatidylserine sensor (green), 7-AAD (red), and cytocalcein violet 450 (blue), respectively. Apoptotic and necrotic cell signal areas were quantified and normalized by the area of the living cell signal. Data are represented as a relative value to non-treated control cells. *P < 0.05, **P < 0.01 and ***P < 0.001 according to Bonferroni’s multiple comparison post hoc test (n = 5 independent experiments). Data represent the mean ± SE.

