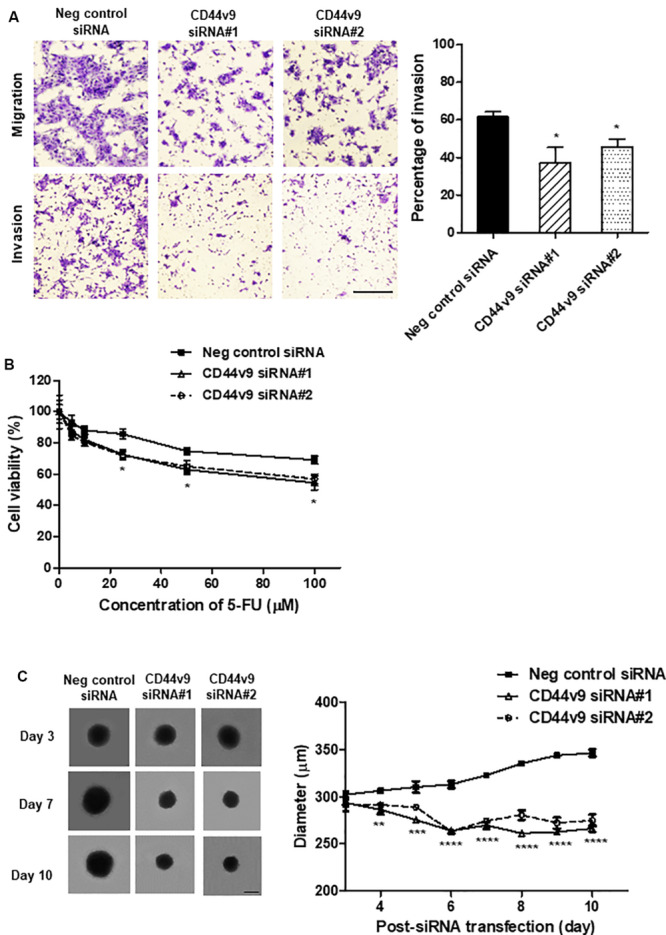
FIGURE 4.

Study of cell migration/invasion and stem cell-like phenotypes in CD44v9 knockdown condition in CCA cells. (A) Morphology of stained migratory and invaded cells (scale bars; 50 μm), and the percentage of invasion. (B) Cell viability with various concentrations of 5-FU for 24 h. (C) Spheroid formation and quantitative diameter of spheroid cells. The values are the mean ± SEM. *p < 0.05, **p < 0.01, ***p < 0.001, ****p < 0.0001 vs. negative control siRNA cells.
