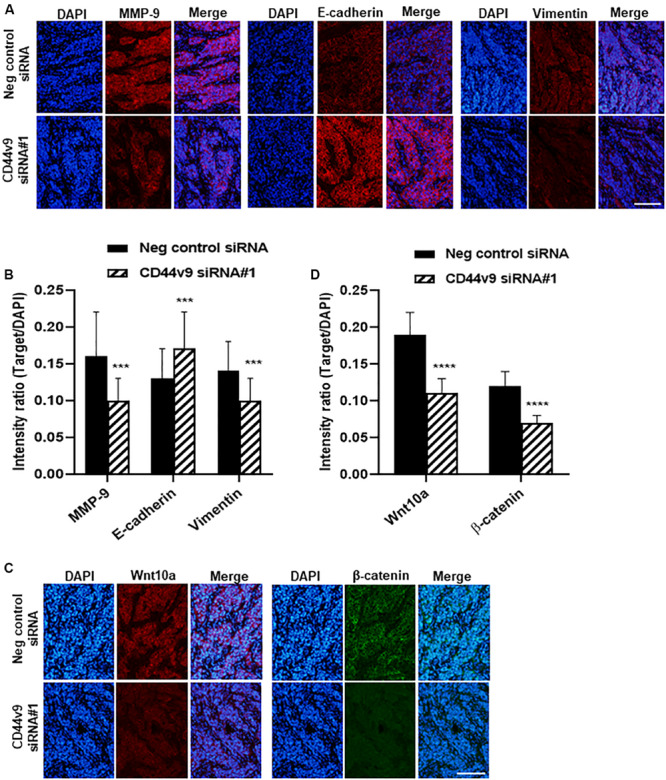
FIGURE 7.

Immunofluorescence staining of relative molecules in EMT and Wnt signaling pathway. (A) Protein levels of MMP9, E-cadherin, vimentin and (C) Wnt10a and β-catenin (scale bars; 50 μm). (B,D) Quantitative intensity was evaluated as a relative ratio (target molecule/DAPI). The values are the mean ± SEM. ***p < 0.001, ****p < 0.0001 vs. negative control siRNA cells.
