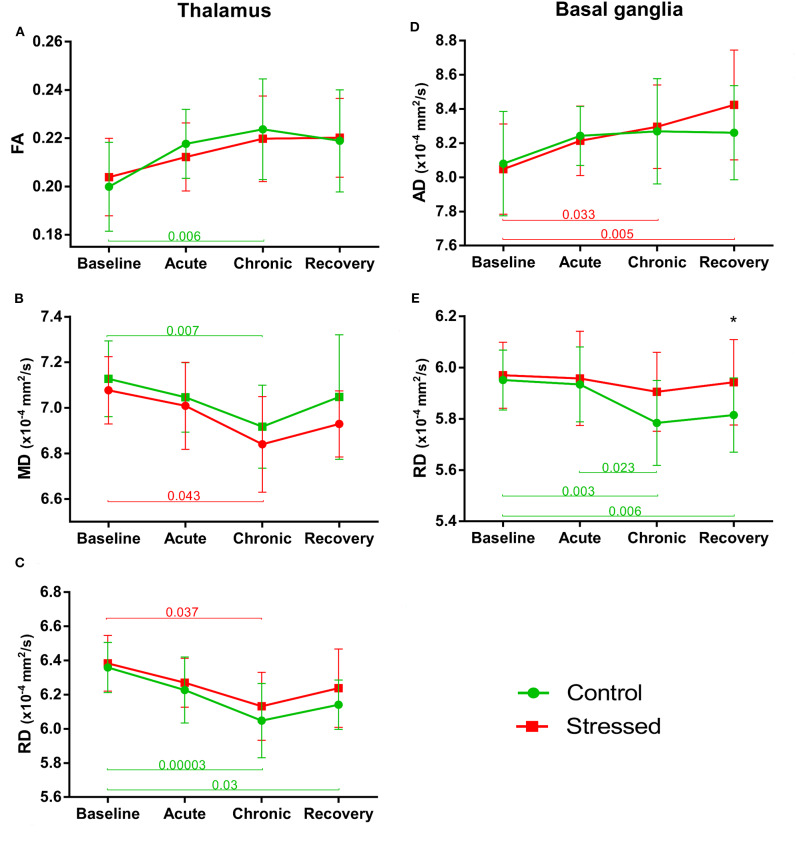
Figure 6.
Stress-induced changes of DTI metrics in gray matter areas II. Longitudinal within- and between-group differences of DTI metrics in the thalamus (A–C) and basal ganglia (D,E). Note that most values changed significantly over time as the animals matured. Data are means ± SD. Asterisk shows significant between-subject differences per time point. FA, Fractional anisotropy; MD, Mean diffusivity; RD, Radial diffusivity; AD, Axial diffusivity.

