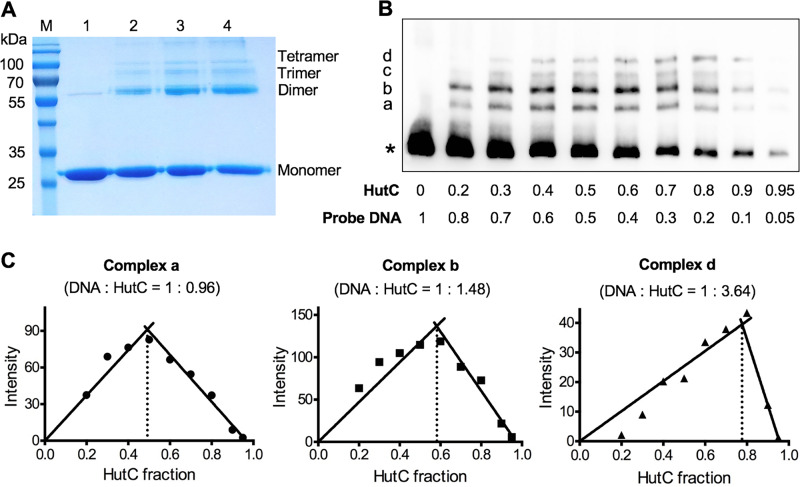
FIG 2.
HutC oligomerization and stoichiometry of HutC-PhutU interactions. (A) Formaldehyde cross-linking was performed with 19 μM HutCHis6 (28.6 kDa), and protein samples in lanes 1 to 4 were treated with 25 mM formaldehyde for 0, 1, 2.5, and 4 h, respectively. (B) EMSA analysis of HutCHis6 and PhutU DNA performed at the final concentration of 0.1 μM in total. The mole fractions of protein and DNA are shown below the gel image for each sample. (C) Job plots of DNA-to-protein ratios for complexes a, b, and d. The lines are the least-square fits to the rising and falling subsets of the data, and their intersection yields the binding stoichiometry of each protein/DNA complex.

