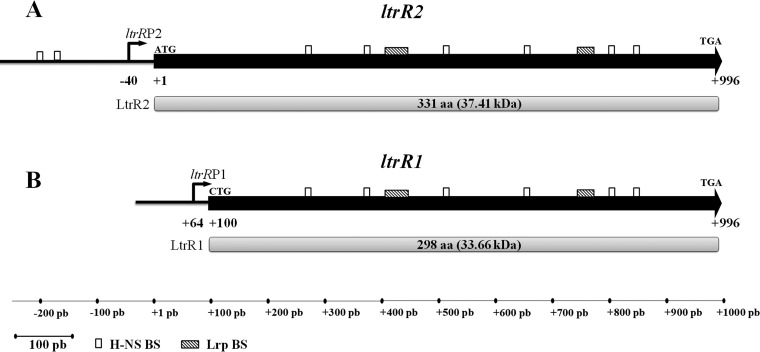
FIG 2.
ltrR2 and ltrR1 genetic organization. Shown are schematic representations of ltrR2 and its corresponding LtrR2 protein of 331 aa (37.41 kDa) (A) and of ltrR1 and its corresponding LtrR1 protein of 298 aa (33.41 kDa) (B). The white rectangles show the putative H-NS-binding sites (BS) predicted by the RSAT matrix-scan program and MATS program (−207TTTATAAAAT−198, −175TTTATAAAAT−166, +266GCGATAAAAC+275, +369TCGATATATT+378, +508CAGATAAATT+517, +649TGAATAAATC+658, +798GCGTTATAAT+807, and +842TTCGTACATT+851). The following Lrp-binding sites (shaded rectangles) were also predicted: +403ACAGGGGAATACTCGCCAGCCTCCATGCTGACGCATGGCT+442 and +744GAAAAAAGCGATATGGTTGCGATTTTGCC+772. Bent arrows represent transcriptional start sites. Translational initiation and stop codons are indicated.

