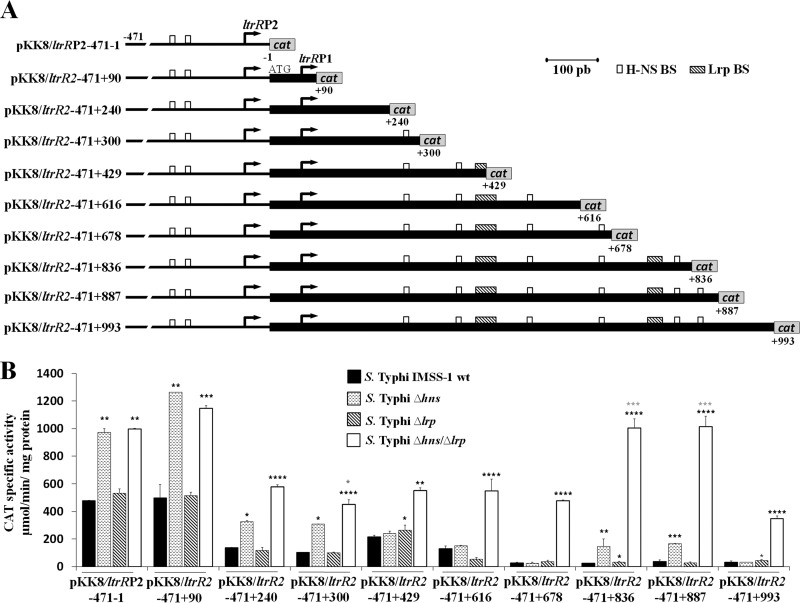
FIG 3.
Transcriptional profile of ltrR2. (A) Fusions were constructed in the pKK232-8 vector and labeled with respect to the ltrR2 ATG initiation codon. The coordinates are given. The white and shaded rectangles show the putative H-NS- and Lrp-binding sites, respectively. (B) Transcriptional profile of ltrR2 fusions evaluated in the wild-type S. Typhi IMSS-1, S. Typhi Δhns, S. Typhi Δlrp, and S. Typhi Δhns Δlrp strains in N-MM at an OD595 of 0.6. The values are the means ± standard deviations from at least three independent experiments performed in duplicate (n ≥ 6). Statistically different values are indicated (*, P < 0.05; **, P < 0.01; ***, P < 0.001; ****, P < 0.0001) comparing wild-type (wt) S. Typhi IMSS-1 versus mutant strains expression levels (black asterisks) and S. Typhi Δhns Δlrp versus S. Typhi Δhns (gray asterisks).

