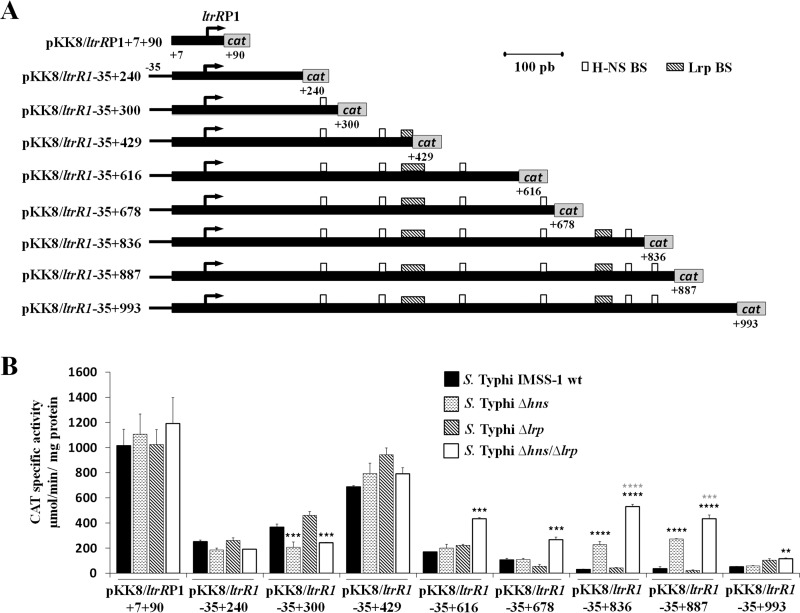
FIG 4.
Transcriptional profile of ltrRP1. (A) The fusions were constructed in the pKK232-8 vector and labeled with regard to the ltrR ATG initiation codon. The coordinates are indicated. The white and shaded rectangles show the putative H-NS- and Lrp-binding sites, respectively. (B) Transcriptional profile of the fusions that contained only the ltrRP1 promoter and different regions of the ltrR1 coding sequence. Transcriptional expression (CAT units) was evaluated in the wild-type S. Typhi IMSS-1, S. Typhi Δhns, S. Typhi Δlrp, and S. Typhi Δhns Δlrp strains in N-MM at an OD595 of 0.6. The values are the means ± standard deviations from at least three independent experiments performed in duplicate (n ≥ 6). Statistically different values are indicated (**, P < 0.01; ***, P < 0.001; ****, P < 0.0001) comparing wild-type S. Typhi IMSS-1 versus mutants strain expression levels (black asterisks) and S. Typhi Δhns Δlrp versus S. Typhi Δhns (gray asterisks).

