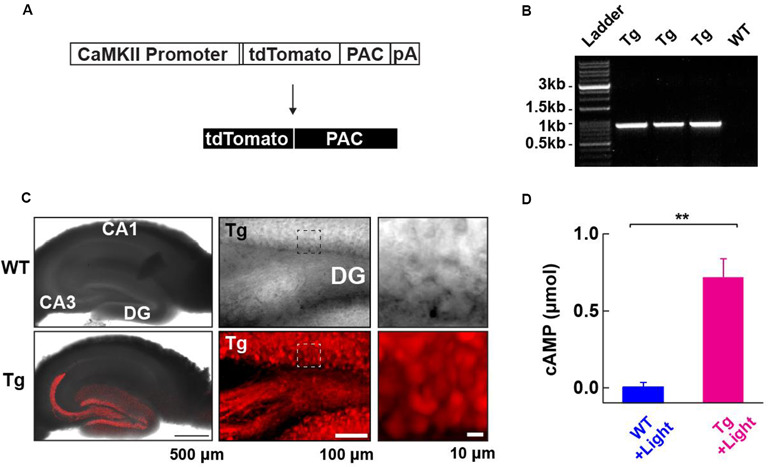
Figure 1.

Generation and characterization of photoactivatable adenylyl cyclase (PAC) expressing transgenic (Tg) mice. (A) Schematic representation of the PAC transgene construct. (B) Genotyping of the Tg(CMV-Camk2a-RFP/PAC)3Koka mice. The specific PCR amplification of an 859 bp band for PAC in Tg, but not wild-type (WT) mice was detected on the agarose gel. (C) Distribution of RFP (tdTomato)-PAC in the hippocampal slice. Left upper: WT (wild type), Left lower: Tg (PAC transgenic mouse). The RFP fluorescence (red color) on the living hippocampal slice was imaged by a confocal microscope and merged with the transmitted light image. Note: the red labeling extending into the CA3 region reflects signals in the mossy fiber axons of the DG granule neurons. Middle: a transmitted light (upper) and the corresponding red fluorescence (lower) deconvoluted confocal images of the hippocampal DG area in a living PAC Tg mouse hippocampal slice. About 85% of DG granule cells (141/163 cells) showed red fluorescence signals above the background level. Right: The transmitted light (upper) and the corresponding red fluorescence (lower) images within the boxed region in the middle images. (D) ELISA-based detection of the light-dependent cAMP production in the WT and Tg hippocampal lysate (per mg total protein) after illumination (455 nm LED, 4.5 mW/mm2, 30 s; each n = 3). **p < 0.01 (unpaired t-test). Data are presented as mean ± SEM.
