Figure 3.
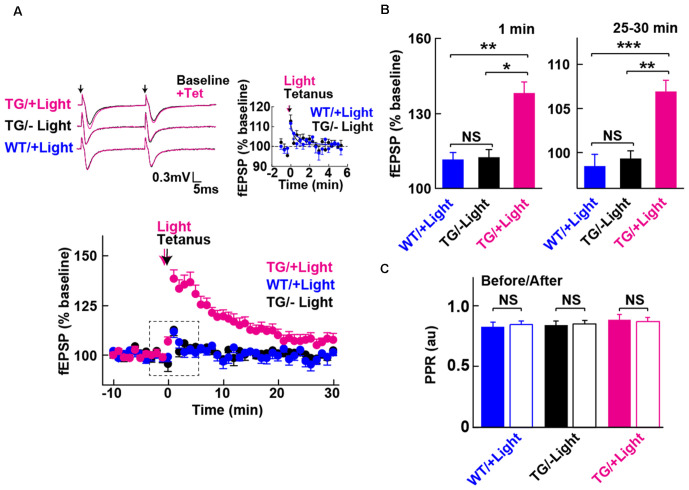
Long-term potentiation (LTP) enabled by photoactivation of PAC. (A) Lower: Blue light (480 nm, 5 min) photoactivation of PAC during tetanic stimulation (100 Hz × 4 trains, arrow) of MPP-DG synapses evoked potentiation of responses that persisted for 30 min. Hippocampal slices from WT mice receiving light, as well as Tg slices not receiving light, showed a transient and relatively small potentiation lasting about a minute (−Light, TG n = 10 slices/3 mice, +Light, TG n = 11 slices/7 mice, +Light, WT n = 13 slices/3 mice). Left upper: sample paired-pulse traces (scale bar of 0.3 mV and 5 ms) show superimposition of the fEPSP response before (Baseline; black) and 1 min after (+Tet; magenta) tetanic stimulation. Black arrows indicate the time of single pulses of stimulation. Right upper: comparison of post-tetanic potentiation within the boxed region in the lower graph showing the fEPSP normalized slope in expanded detail for the two control conditions, WT littermates in the presence of blue light (cyan) and Tg animals without blue light (black). (B) Quantification of synaptic potentiation at 1 min and 25–30 min after tetanus (A). *p < 0.05, **p < 0.01, ***p < 0.001 (Tukey test). (C) Comparison of PPR before (−10 to 0 min) and after the tetanic stimulation (10–20 min) in the three conditions revealed no statistically significant differences (sample size identical to A). NS, p > 0.05 (paired t-test). All data displayed are mean ± SEM.

