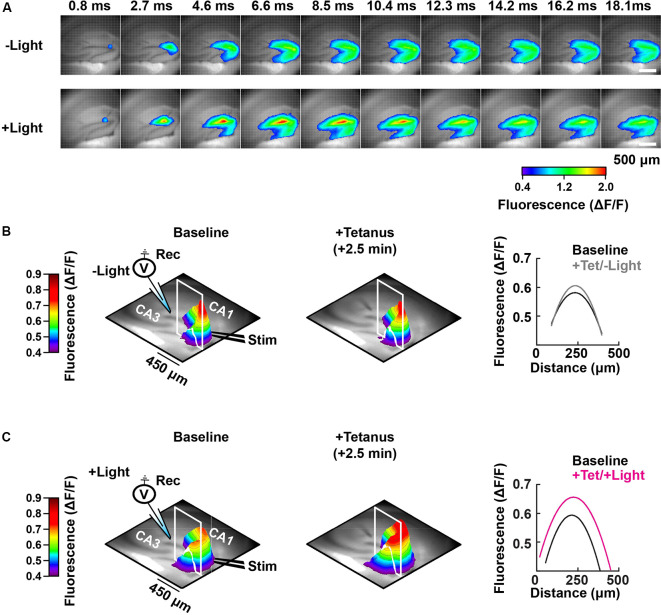
Figure 5.
Spatial-temporal mapping of the PAC-induced enhancement of DG depolarization. (A) Representative time-lapse images of the VSD fluorescence change (depicted in pseudocolor scale) after tetanus, collected either without (−Light; upper row) or with photostimulation to activate PAC (+Light; lower row). (B) Left and middle: pseudo-colored 3D graph of the averaged peak VSD fluorescence change in the hippocampal DG region before (Baseline) and after tetanic stimulation (+Tetanus). The 3D fluorescence images were calculated as the ratio of the fluorescence changes before and after tetanus. Right: fluorescence profiles across the lines in the 3D fluorescence distribution (white line of left and middle) fitted with a parabola. Black, before tetanic stimulation (Baseline); grey, after tetanic stimulation without photostimulation to activate PAC (+Tet/−Light); magenta, after tetanic stimulation with the photostimulation (+Tet/+Light). The same analysis shown in panel (B) which was performed without PAC activation (−Light; n = 56 images/7 slices/2 mice), was repeated in panel (C) with PAC (+Light; n = 64 images/8 slices/2 mice) activation, respectively.

