
Figure 3.
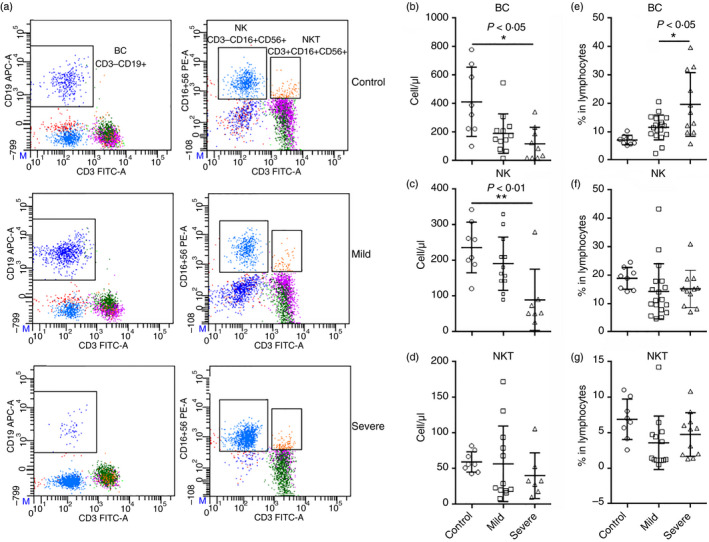
The number of blood B cells, natural killer (NK) cells and natural killer T (NKT) cells in patients with coronavirus disease 2019 (COVID‐19) at hospital admission. (a) Representative flow cytometry dot plots showing the gating strategy for B cells, NK cells and NKT cells. (b–d) The number of B cells (b), NK cells (c) and NKT cells (d). (e–g) Frequencies of indicated cells in lymphocytes. *P < 0·05; **P < 0·01. Kruskal–Wallis test for comparing the median difference