
Figure 5.
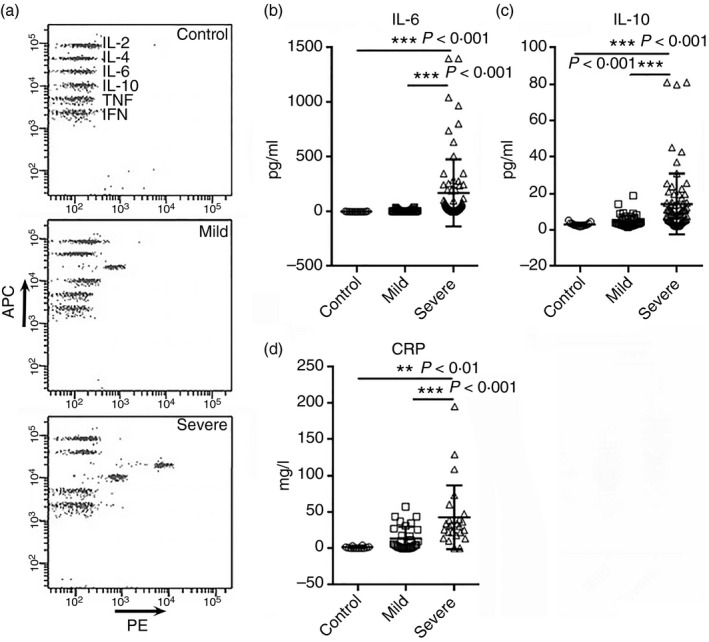
Cytokine and C‐reactive protein (CRP) levels in patients with coronavirus disease 2019 (COVID‐19). (a) Representative flow cytometry dot plots showing the cytokine expression in patients. (b, c) Concentrations of serum interleukin‐6 (IL‐6) and IL‐10 in patients at hospital admission (d) Serum CRP levels in patients. **P < 0·01; ***P < 0·001. One‐way analysis of variance for comparing the mean difference