
FIGURE 1.
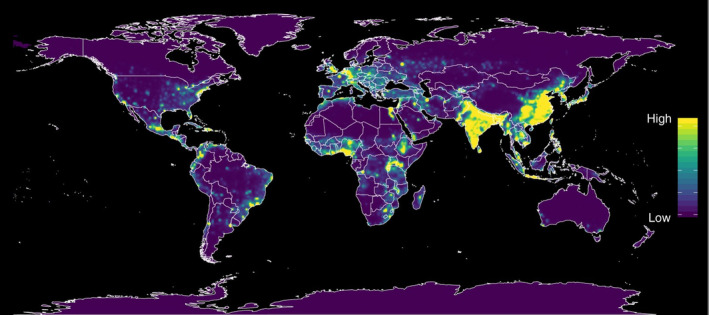
Heat maps of predicted relative risk distribution of zoonotic emerging disease threats. The CoV‐2 coronavirus arose in one of these “hot‐spots” 2 [Color figure can be viewed at wileyonlinelibrary.com]
Official websites use .gov
A
.gov website belongs to an official
government organization in the United States.
Secure .gov websites use HTTPS
A lock (
) or https:// means you've safely
connected to the .gov website. Share sensitive
information only on official, secure websites.
Heat maps of predicted relative risk distribution of zoonotic emerging disease threats. The CoV‐2 coronavirus arose in one of these “hot‐spots” 2 [Color figure can be viewed at wileyonlinelibrary.com]