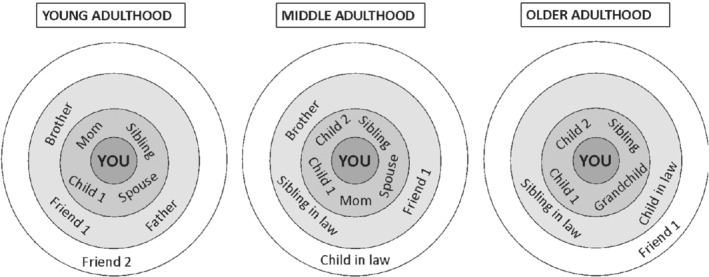
Figure 3.

example of convoy change over time.
Note. Hypothetical figures based on data for mean circle size and composition in 2015 (Survey Research Center, 2015) synthesized to represent a hypothetical average individual.

example of convoy change over time.
Note. Hypothetical figures based on data for mean circle size and composition in 2015 (Survey Research Center, 2015) synthesized to represent a hypothetical average individual.