Figure 1.
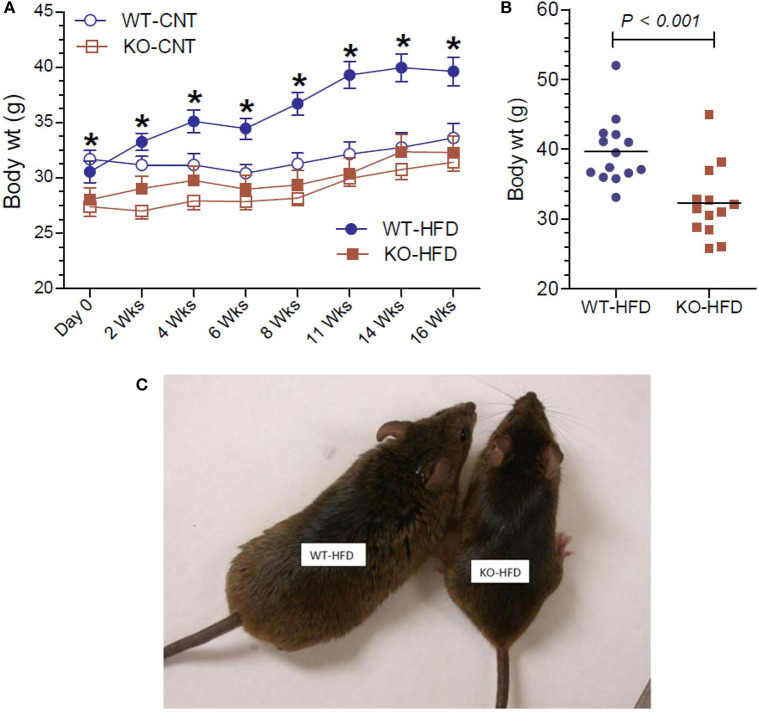
Body weights of WT and P2Y2 KO mice fed regular or high-fat diets. (A) Shows changes in the mean body weights over the time in WT and P2Y2 KO mice fed regular (CNT) or high-fat (HFD) diets. (N = 6 mice/genotype in CNT groups and N = 14 mice/genotype in HFD groups). *P < 0.05 or better as compared to the corresponding mean weights in the HFD-fed KO mice by direct comparison by unpaired t-test. (B) Shows scatter graph of terminal body weights in HFD-fed WT and P2Y2 KO mice. (C) Shows picture of one of the obese WT mice fed HFD vs. an average weighing KO mouse fed HFD after 16 weeks of feeding.

