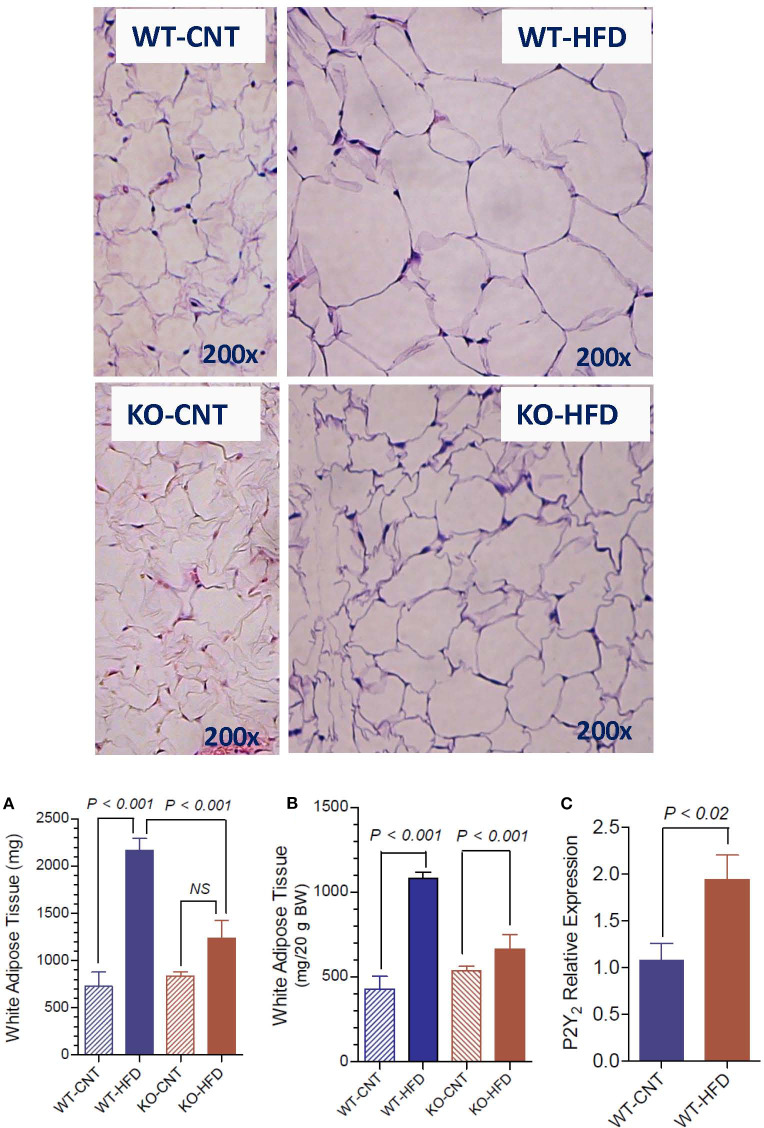
Figure 3.
Morphological appearance and mean terminal weights of white adipose tissue in WT and P2Y2 KO mice fed regular of high-fat diets. Upper panels show representative profiles of hematoxylin-eosin stained paraffin sections of white adipose tissue from WT and KO mice fed regular (CNT) or high-fat (HFD) diets for 16 weeks. All profiles are shown at the same final magnification (200x). (A,B) Show the mean terminal weights of white adipose tissue in WT and KO mice fed regular (CNT) or high-fat (HFD) diets, as mg total weight per mouse or as mg/20 g body weight, respectively (N = 6 mice/genotype for CNT; N = 12–14 mice/genotype for HFD). Statistics by ANOVA followed by Tukey-Kramer Multiple Comparison Test. (C) Shows mRNA expression of P2Y2 receptor relative to the mRNA expression of β-actin in the white fat of WT mice fed regular or high-fat diets (N = 6 mice/group); statistics by unpaired t-test.

