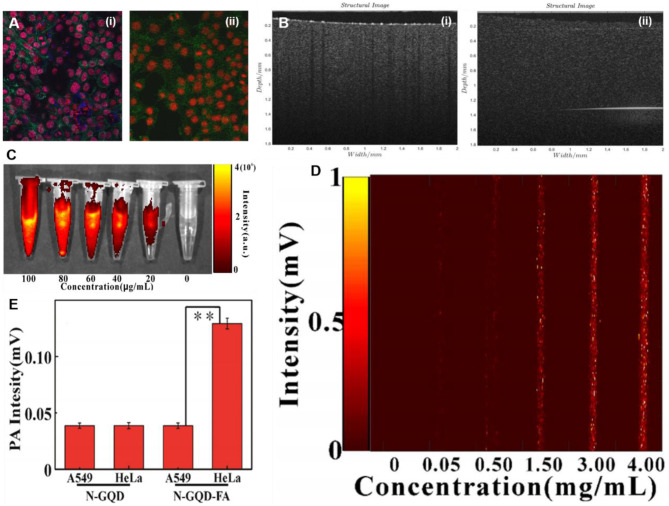
Figure 14.
(A) Visible light, confocal microscopic (CLSM) images of superparamagnetic GQDs (MGQDs) labeled (i) and unlabeled (ii) 3T3 cells. (B) magnetomotive optical coherence tomography (OCT) images of MGQDs labeled (i) and unlabeled (ii) 3T3 cells; reproduced from Li et al. (2019) with permission from Wiley. (C,D) Concentration-dependent enhanced near-infrared (NIR) fluorescence as well as photoacoustic imaging (PAI) signal. (E) In Vitro PAI intensity of FA-N-GQDs and N-GQDs in both HeLa cells and A549 cells, respectively; reproduced from Xuan et al. (2018) with permission from IOP Publishing. **means P value is 0.05.

