FIGURE 4.

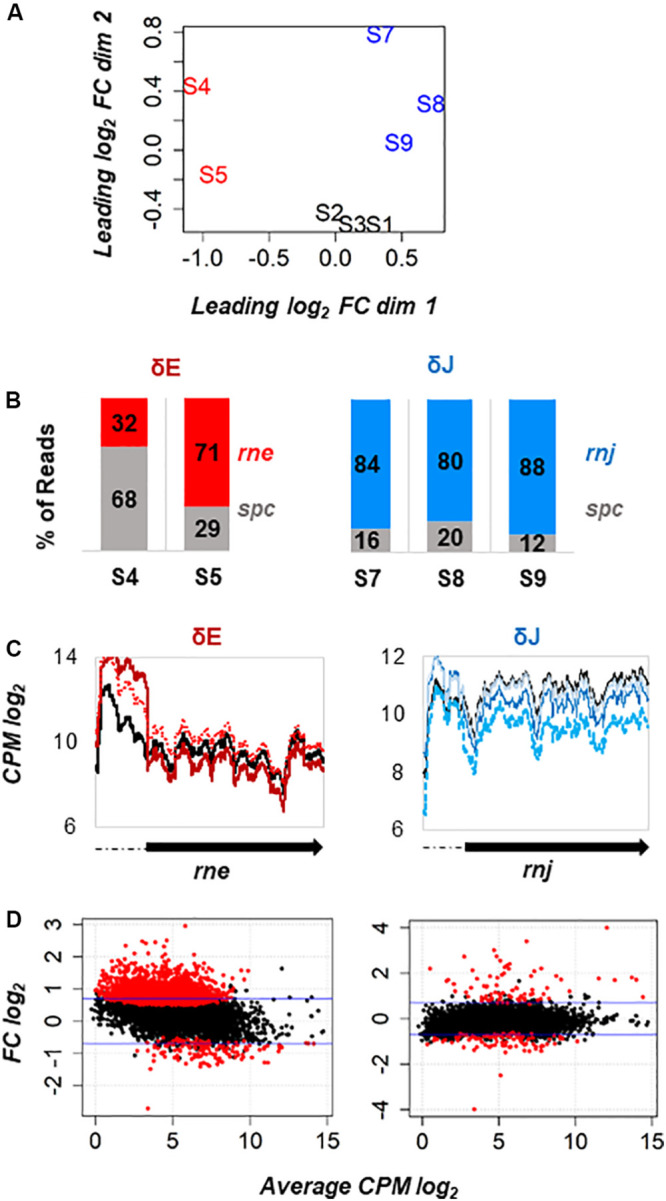
Transcriptome analysis of rne and rnj partial deletion strains. (A) Multidimensional scaling (MDS) plot of WT-Spc (S1, S2, S3), δE (S4, S5) and δJ (S7, S8, S9) libraries. Distance between samples is based on the leading log2 fold-change (FC) of the top 500 most differentially regulated genes. (B) Proportion of reads mapped to the Spc coding region (in gray) and to the rne (in red) and rnj (in blue) coding sequence with respect to the total spc+rne and spc+rnj reads, respectively, is shown for each mutant replicate. (C) Coverage profile expressed as log2 count per million (CPM) along the rne and rnj genes in each replicate: WT black solid line, S4 red solid line, S5 red dotted line, S7 blue dotted line, S8 blue solid line and S9 powder blue solid line. (D) MA plot of differentially expressed genes (red dots) at FDR < 0.05 identified in δE and δJ strains. The ordinate represents log2 FC.
