FIGURE 5.

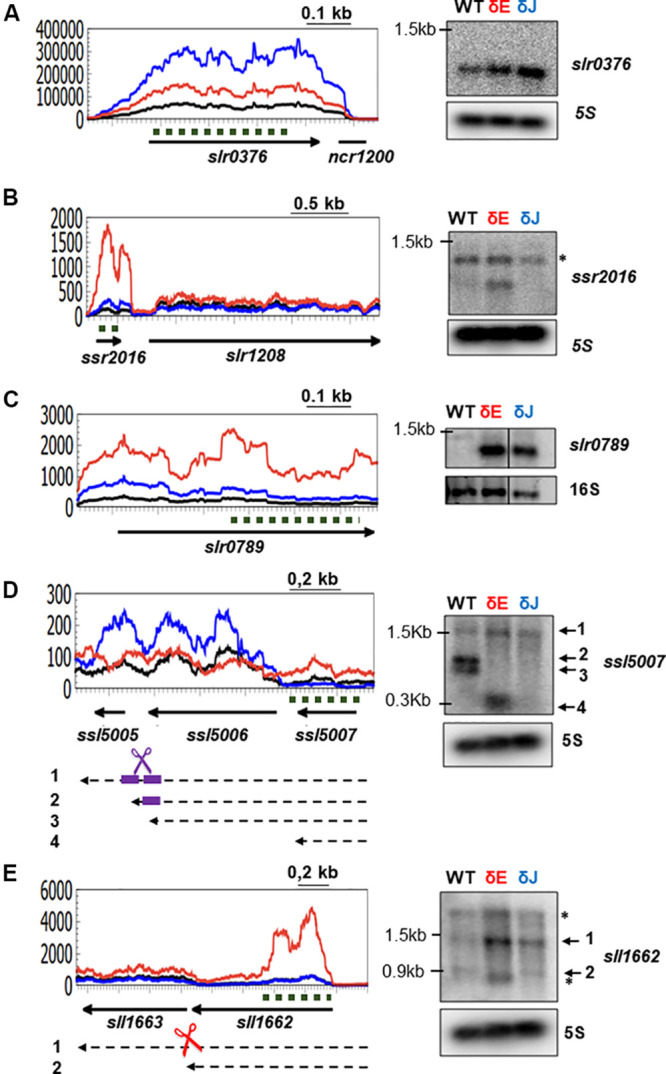
Analysis of specific transcript patterns in δE and δJ mutants. On the left, RNA-Seq coverage along the slr0376 (A), ssr2016 (B), slr0789 (C), ssl5007 (D), and sll1662 (E) genes. The δE (in red) and δJ (in blue) strains are compared to the WT-Spc (in black). Arrows represent the ORF and the orientation on the genome; black dashed arrows represent the mRNA; dashed dark green lines indicate the probe used in the Northern blots (right panels). Scissors indicate an endoribonuclease cleavage: RNase E (red), RNase J (blue) and RNase E and J (violet). The two potential cleavage sites in (D) are indicated by thick violet short lines. 5S and 16S rRNA were used as loading control. Unspecific signals are indicated by asterisks.
