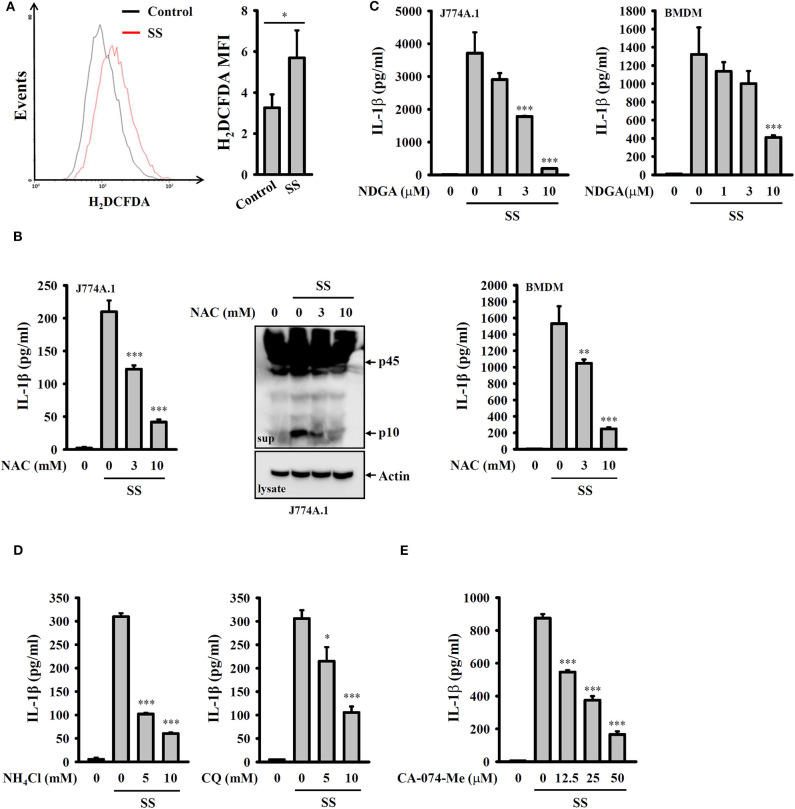
Figure 4.
S. sonnei activates the NLRP3 inflammasome through H2O2 production and lysosomal damage. (A) J774A.1 macrophages were primed with 1 μg/ml LPS for 4 h and then infected with 50 MOI S. sonnei for an additional 20 h. The levels of intracellular ROS were measured by CM-H2DCFDA staining, and the data were acquired by flow cytometry. (B) J774A.1 macrophages or BMDM were primed with 1 μg/ml LPS for 4 h and then treated with NAC for 0.5 h. The cells were then infected with 50 MOI S. sonnei for an additional 20 h. The levels of IL-1β and caspase-1 in the supernatants were measured by ELISA and Western blotting, respectively. (C) J774A.1 macrophages or BMDM were primed with 1 μg/ml LPS for 4 h and then treated with NDGA for 0.5 h. The cells were then infected with 50 MOI S. sonnei for an additional 20 h. The levels of IL-1β in the supernatants were measured by ELISA. (D,E) J774A.1 macrophages were primed with 1 μg/ml LPS for 4 h and then treated with NH4Cl and CQ (D) or CA-074-Me (E) for 0.5 h. The cells were then infected with 50 MOI S. sonnei for an additional 20 h. The levels of IL-1β in the supernatants were measured by ELISA. The ELISA data are expressed as the mean ± SD of four separate experiments. The flow cytometry and Western blotting results are representative of three different experiments. *, **, and *** indicate significant differences at the levels of p < 0.05, p < 0.01 and p < 0.001, respectively, compared to untreated control cells (A) or S. sonnei-infected cells (B–E) [two-tailed t-test in panel (A); one-way ANOVA with Dunnett's multiple comparisons test in panels (B–E)].

