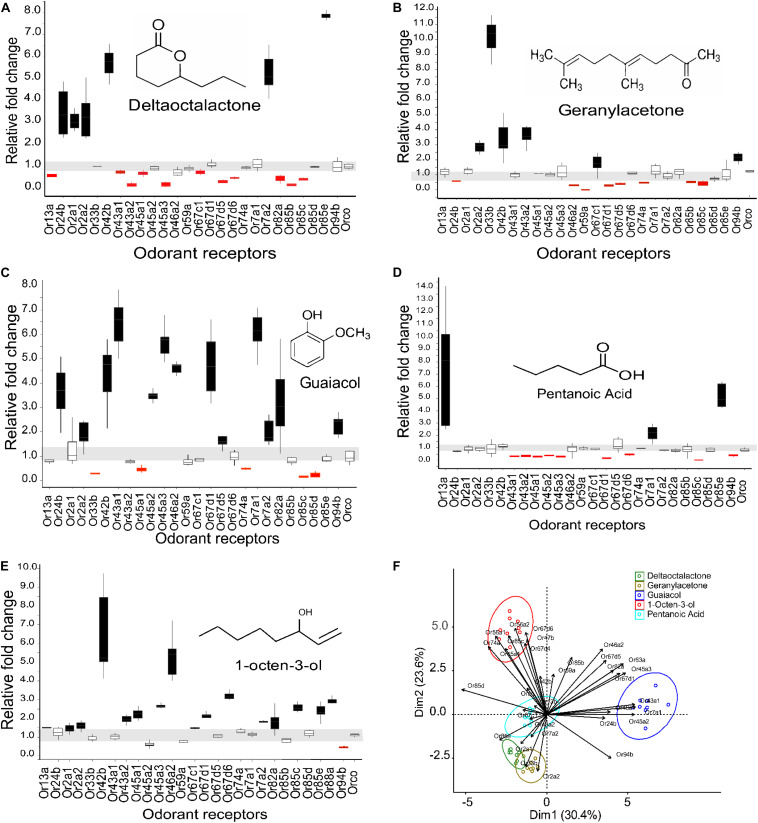
FIGURE 2.
Expression pattern of G. f. fuscipes odorant receptors after exposure to WRB components and 1-octen-3-ol. The horizontal gray zone corresponds to OR mRNA transcript values that were not affected. (A) Expression pattern of ORs to δ-octalactone. (B) Expression pattern of ORs to geranylacetone. (C) Expression pattern of ORs to guaiacol. (D) Expression patterns of ORs to pentanoic acid. (E) Expression pattern of ORs to 1-octen-3-ol. (F) PCA plot showing the clustering pattern of the five tested ligands based on the fold change of the mRNA of ORs (A–E). The PCA explained 53.6% of the total variation. ORs that do not fall into one of the cluster circles (F) show that the mRNA transcript level was not affected by the odorant exposure. The graphs and the statistics were generated using R software21 (version 3.5.1), www.R-project.org. (PCA) was performed using two R packages called “FactoMineR” and “Factoextra” (Kassambara, 2017).

