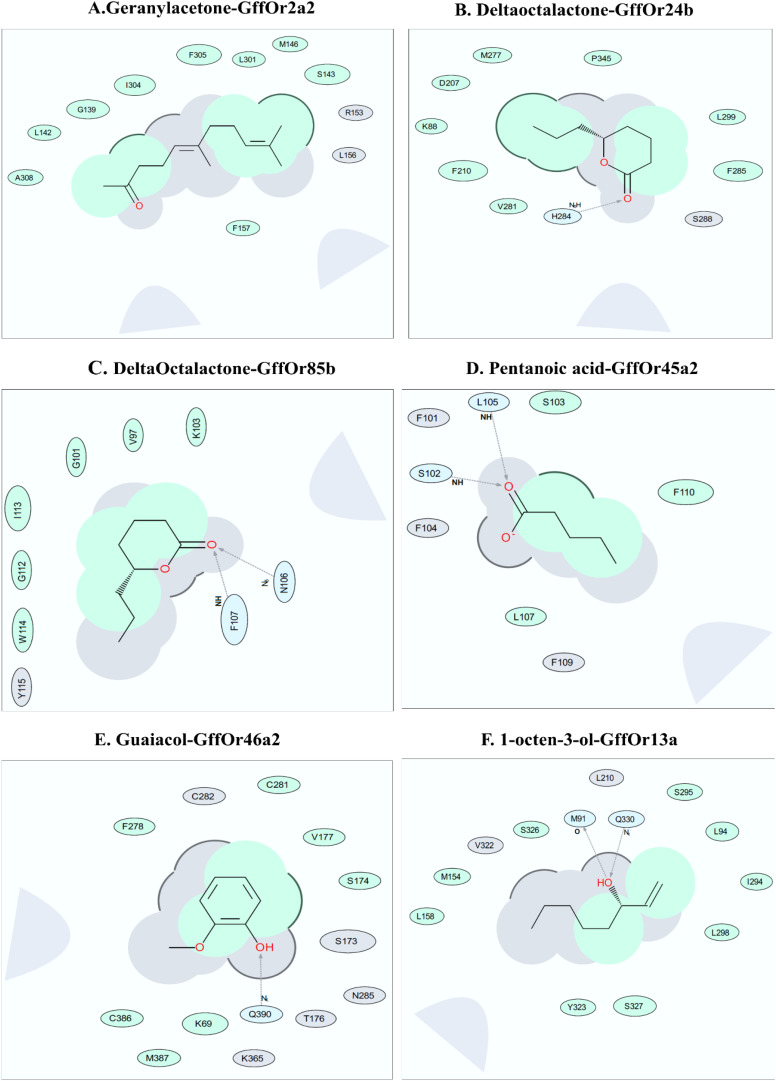
FIGURE 7.
Bioinformatics analysis for the interaction of the different ligands with their putative odorant receptors. Amino acid residues in interaction within 5 Å of ligands as depicted by the ligand interaction diagram for pairs (A) Geranyl acetone-GffOr2a2, (B) δ-octalactone_GffOr24b, (C) δ-octalactone-GffOr85b, (D) pentanoic acid-GffOr45a2, (E) Guaiacol-GffOr46a2, and (F) 1-octen-3-ol-GffOr13a. Generated using ICM-Pro software (Ruben Abagyan, 1994) (version 3.8-7, MolSoft LCC, San Diego, CA, United States, www.molsoft.com). Green shading represents the hydrophobic region; white dashed arrows represent hydrogen bonds; gray parabolas represent accessible surface for large areas. The broken thick line around the ligand shape indicates an accessible surface. The size of the residue ellipse represents the strength of the contact.

