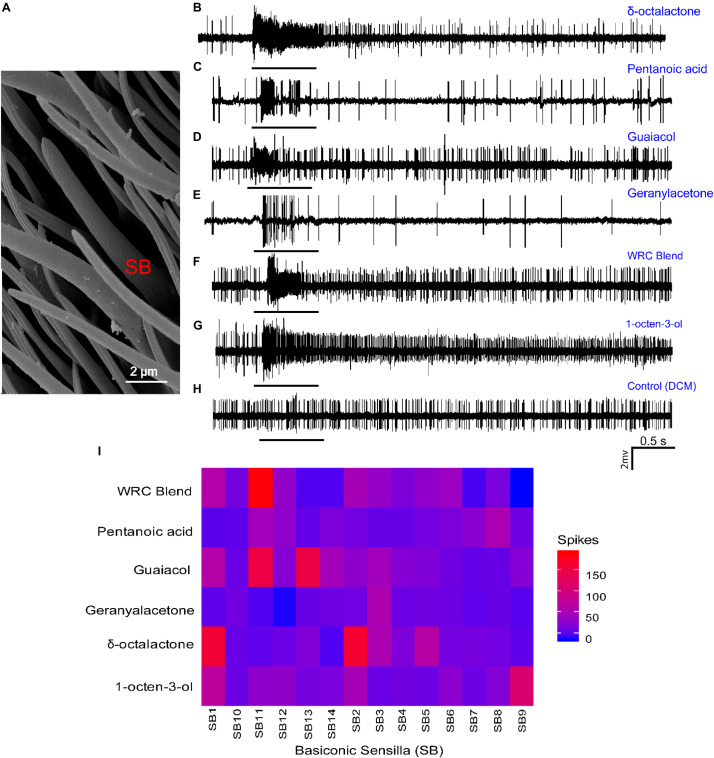
FIGURE 8.
Cellular response patterns of basiconic sensilla of G. f. fuscipes to different chemicals. (A) Scanning electron micrograph of the basiconic Sensilla (SB) of G. f. fuscipes. (B–H) Representative single-sensillum recording (SSR) traces, showing responses to the indicated odorant and the control (DCM). (I) Heatmap of OSN response patterns of 14 basiconic sensilla of G. f. fuscipes elicited by different odors used in DREAM techniques, generated using R software version 3.5.1 (R Core Team, 2018), www.R-project.org, edited using Adobe illustrator CS5.1.

