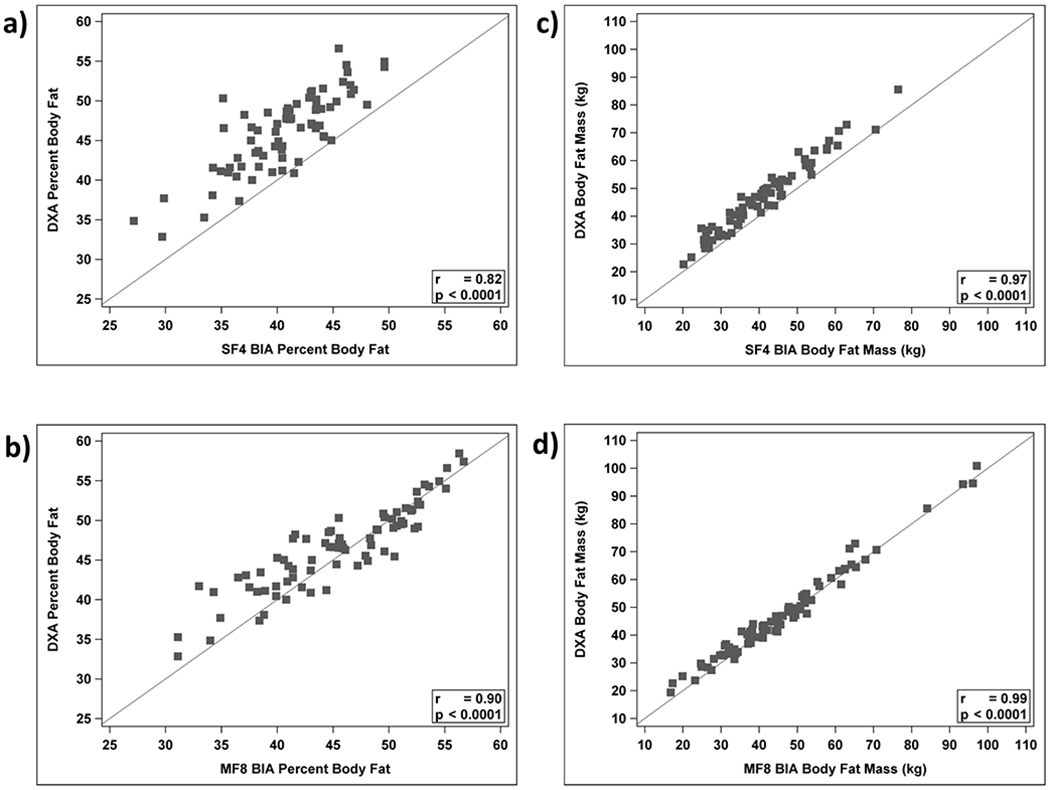
Figure 1:

Body fat percentage by a) SF4 BIA (x-axis) b) MF8 BIA (x-axis) versus body fat percentage by DXA (y-axis). Fat mass by c) SF4 BIA (x-axis) d) MF8 BIA (x-axis) versus fat mass by DXA (y-axis). Solid line is the line of identity. Pearson correlations are listed in the graphs. Intraclass correlation coefficients are a) 0.39, b) 0.87, c) 0.92, and d) 0.99, respectively.
