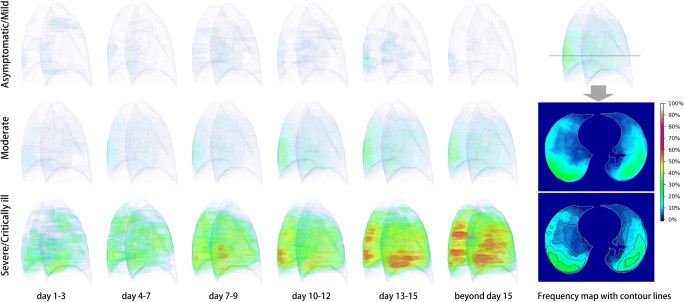
Fig. 2.
Three-dimensional heat maps show the frequency of location of pulmonary opacities in COVID-19 from the onset of symptoms (day 1) to beyond day 15. Asymptomatic/mild patients have trace opacities, resolving partially after 15 days (top row). Moderately ill patients have more opacities and peaked on days 13–15, predominantly located in the posteroinferior subpleural area (middle row). Severe/critically ill patients have the most prominent opacities and continue to progress beyond day 15 (bottom row). Axial frequency map shows a typical pattern of posterior subpleural distribution of the opacities with decreased frequency in the anterior and medial subpleural areas

