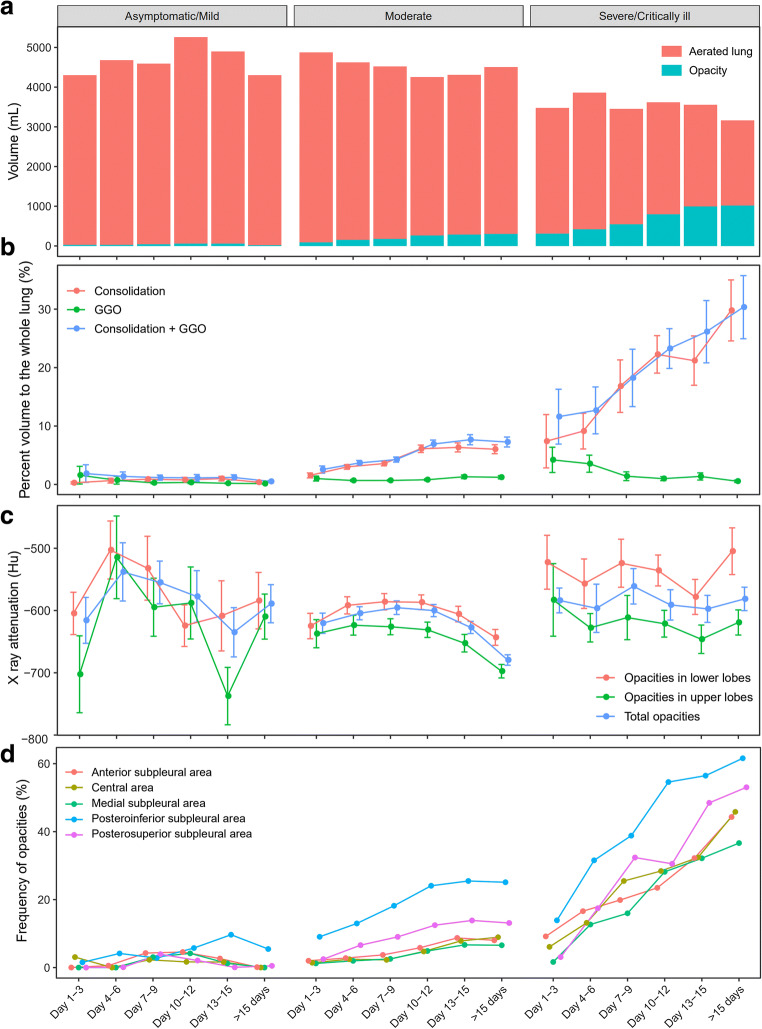
Fig. 3.
a–d CT measurements changing by day. a In the severe/critically ill group, volume of aerated lung decreased while pulmonary opacities increased by day. b Volume of consolidation kept growing beyond 15 days in the severe/critically ill group, while peaked on days 13–15 in the moderate group. c The density of opacities dropped after day 12 in the moderate group; opacities in lower lobes had higher attenuation than those in upper lobes. d Posteroinferior subpleural area was the most commonly involved location in the lung, and the variation trend was similar to volume change in b

