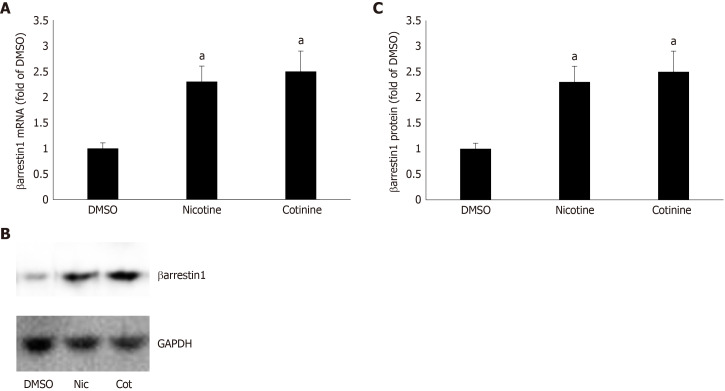
Figure 1.
Effect of tobacco compounds on βarrestin1 levels in AZG cells. A: βarrestin1 mRNA levels in H295R cells treated for 24 h with 10 μmol/L nicotine or 10 μmol/L cotinine or vehicle. B-C: Protein levels in H295R cells treated for 24 h with 10 μmol/L nicotine or 10 μmol/L cotinine or vehicle. Representative western blots are shown in (B), along with glyceraldehyde 3-phosphate dehydrogenase as loading control, and the densitometric quantitation of three independent cell extracts per condition run in duplicate (and normalized with glyceraldehyde 3-phosphate dehydrogenase levels) is shown in (C). aP < 0.05 vs vehicle, n = 3 independent experiments/treatment in duplicate. DMSO: Vehicle; Cot: Cotinine; Nic: Nicotine; GAPDH: Glyceraldehyde 3-phosphate dehydrogenase.

