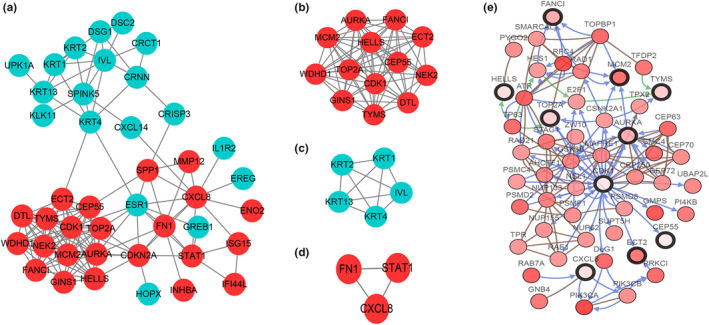
FIGURE 4.

PPI network, most significant module of DEGs and Interaction network of the hub genes. (a) PPI network of DEGs was constructed in Cytoscape, red nodes represents upregulated genes, and blue nodes represents downregulated genes. (b–d) There modules were obtained from PPI network using MCODE plug‐in in Cytoscape. (e) Hub genes and their coexpression genes were analyzed by cBioPortal. Nodes with bold black outline mean hub genes. Nodes with thin black outline the coexpression genes. DEGs, differentially expressed genes; MCODE, molecular complex detection; PPI, protein–protein interaction
