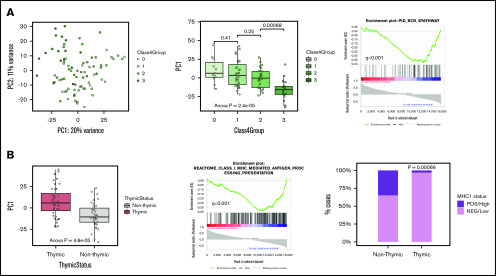
Figure 3.
PCA of GZL spectrum samples. (A) The left plot shows group 0, bona fide GZL, and group 3 samples in PC1 vs PC2 space, reflecting 20% and 11% of the variance, respectively. The middle box plot shows the distribution of PC1 scores based on GZL group (each point represents a sample). Group 3 cases have significantly distinct PC1 scores, whereas group 0 do not (pairwise Student t tests). Group 1 and 2 GZL cases (bona fide GZL) also have similar PC1 scores (P = .25). The right plot shows that B-cell receptor (BCR) pathway genes were strongly negatively correlated with PC1 score, suggesting association with group 3 cases. (B) The left box plot shows PC1 scores based on thymic status within this cohort. In preranked GSEA (middle panel), genes negatively correlated with PC1 score were enriched in the class I antigen presentation pathway, suggesting that non-thymic cases may present a stronger MHC-I presentation machinery compared with thymic cases. Validating the GSEA findings, cases with thymic involvement had significantly lower MHC-I expression (assessed via IHC) compared with cases without thymic involvement (97% vs 66% for thymic vs non-thymic, respectively; χ2 test, P = .00066).

