Figure 1.
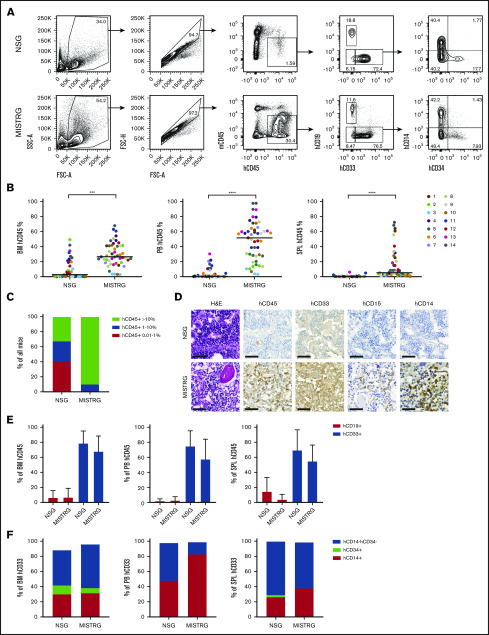
Human MF engraftment in NSG and MISTRG mice. (A) Scatter plots depicting total human engraftment (hCD45+) and lineage distribution. (B) Total human engraftment of 14 MF samples in the BM, PB, and SPL of NSG and MISTRG mice. Each dot represents an individual mouse and each color represents an individual patient. (C) Percentage of NSG and MISTRG mice with human BM engraftment levels as indicated. (D) Representative H&E and immunohistochemical (IHC) photomicrographs for hCD45, hCD33, hCD15, and hCD14 of the BM of an NSG and MISTRG mice transplanted with the same patient sample (patient 1) (scale bars, 50 µm; original magnification ×400). (E) Relative contribution of human B-lymphoid and myeloid cells to the total human engraftment in the BM, PB, and SPL of NSG and MISTRG mice. (F) Relative contribution of monocytes (CD14+CD34−), hematopoietic stem and progenitor cells (CD14−CD34+), and other cells (CD14−CD34−) to total human myeloid cells in the BM, PB, and SPL. Results are represented as grand median (B-C,F) and mean ± standard deviation (E). ***P < .001; ****P < .0001 (Mann-Whitney U test). FSC-A, forward scatter area; SSC-A, side scatter area; FSC-H, forward scatter height.

