Figure 4.
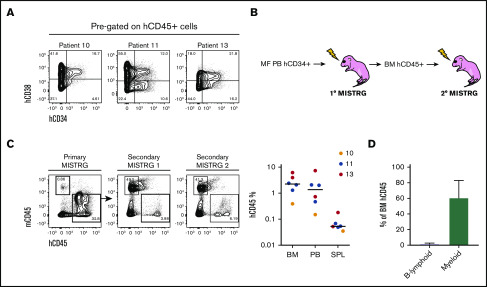
Characterization of MF HSPCs and serial repopulation analysis. (A) Representative flow cytometry plots of the human stem (hCD34+hCD38−) and progenitor (hCD34+hCD38+) cell fraction out of total hCD45+ cells from 3 MISTRG mice transplanted with 3 different samples (10, 11, and 13). (B) Workflow for serial transplantation of purified hCD45+ cells from primary into secondary MISTRG mice. (C, left) Flow cytometry plots of primary and secondary MISTRG mice from sample 13, 9.7 weeks (primary MISTRG) and 17.9 weeks (secondary MISTRG) post-transplantation, respectively. (C, right) Total human engraftment in the BM, PB, and SPL of secondary MISTRG recipients. Each dot represents an individual mouse; each color represents an individual patient. (D) Distribution of human B-lymphoid and myeloid lineages. Results are expressed as mean ± standard deviation.

