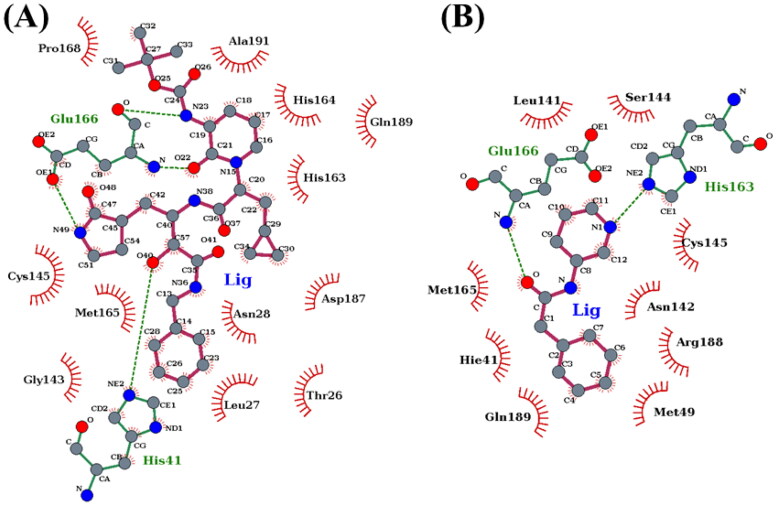
Figure 9.
The receptor-ligand interaction profile for (A) α-ketoamide and (B) Z31792168. The plots are generated by using Ligplot+. Hydrogen bonds are shown as green dotted lines. Red semicircles show the residues involved in the hydrophobic contacts, and residues involved in hydrogen bonds are represented in green. The inhibitors are described as balls and sticks.

