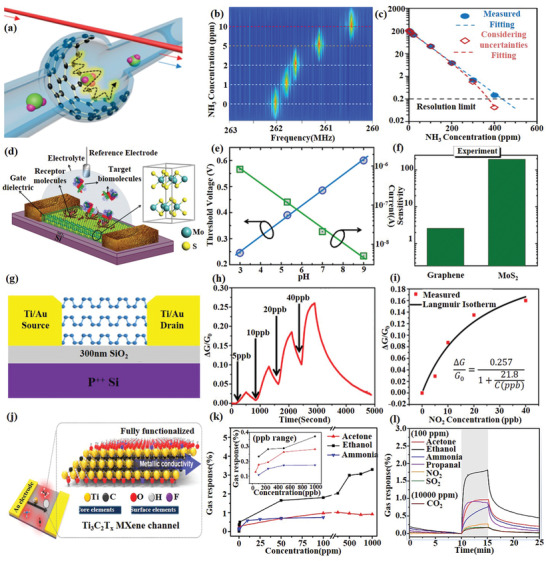
Figure 11.

2D material‐based sensors. a) the schematic design of the graphene enhanced Brillouin microresonator. b) Colored map of the beat note spectra varies with the NH3 gas concentration. c) Sensitivity as a function of gas concentration. Reproduced with permission.[ 171 ] Copyright 2017, American Chemical Society. d) Schematic diagram of MoS2‐based FET biosensor. e) Change in threshold voltage and current of the MoS2 FET for a wide range of pH (3–9). f) Comparison of sensitivity of graphene and MoS2‐based FET biosensors. Reproduced with permission.[ 183 ] Copyright 2014, American Chemical Society. g) Schematic diagram of BP‐based FET gas sensor. h) Relative conductance change versus time in seconds for a multilayer BP sensor showing a sensitivity to NO2 concentrations (5–40 ppb). i) Relative conductance change versus NO2 concentration applied to the BP FET. Reproduced with permission.[ 173 ] Copyright 2017, American Chemical Society. j) Schematic illustration of Ti3C2Tx films and their structural and surface characterizations. k) Maximal resistance change in a wide range of diluted target gases (0.05–1000 ppm). l) Resistance variation upon exposure to 100 ppm of acetone, ethanol, ammonia, propanal, NO2, SO2, and 10 000 ppm of CO2 at room temperature (25 °C). Reproduced with permission.[ 198 ] Copyright 2018, American Chemical Society.
