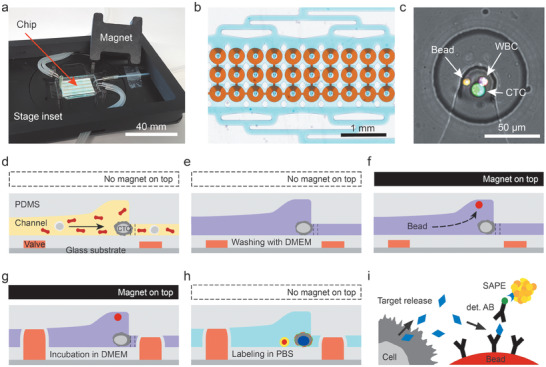
Figure 1.

Microfluidic chip design and operation for CTC capture and analysis. a) The measurement setup consists of the microfluidic chip, the chip holder that can be mounted on the microscope stage and the lid with a permanent magnet. The photograph also shows tubes that establish fluidic and pneumatic connections to the syringe pump and pressure system, respectively. b) Micrograph of a subset of 30 analysis chambers. Each chip holds in total 1152 CTC analysis chambers arranged in four segments, each with three rows of 96 chambers. c) Zoom into the center of one analysis chambers, where size‐selective trapping of CTCs and magnetic trapping of beads are realized. Here, a CTC‐WBC cluster together with a single magnetic bead was captured and stained. The two visible light gray lines are micropillars that aid CTC capture in the cell trap. d–h) Schematics of the workflow; dashed lines indicate positions of micropillars. d) First, CTCs are captured from whole blood at the fluidic constrictions in the center of the chambers. After a successive e) washing step, magnetic beads are supplied and co‐immobilized with the CTCs. f) Therefore, the lid with the magnet is placed on top of the microchip to attract the magnetic beads. g) Next, the valves are actuated to form the analysis chamber with a volume of 80 pL. During incubation, secreted cytokine G‐CSF is bound to anti‐G‐CSF antibodies on the bead surface. Finally, the chambers are washed and labeling is conducted. h) After final washing, the microfluidic chip can be imaged. The magnet is not required during this time. i) Schematics of the sandwich immunoassay employed to detect G‐CSF.
