
Figure 3.
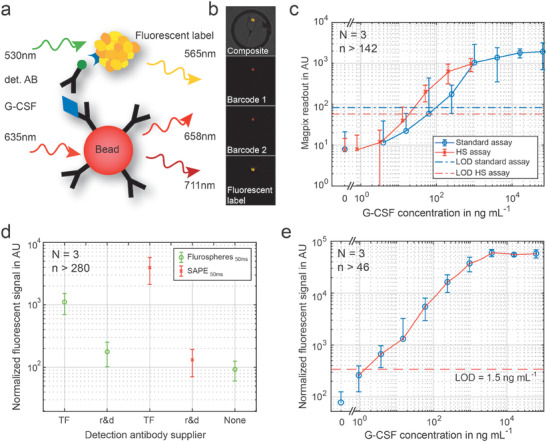
Optimization of the G‐CSF assay on fluorescently barcoded magnetic beads. a) Schematics of the sandwich immunoassay, which is performed on magnetic beads functionalized with the capture antibody. The biotinylated detection antibody (det. AB) is tagged with a fluorescent label. We finally chose streptavidin‐conjugated phycoerythrin (SAPE). b) Fluorescent signal on one bead trapped in a single microchamber. We used barcoded beads to unambiguously identify and localize the bead. c) G‐CSF sandwich immunoassay performed in microwell plates. Two different assays from TF were tested, the standard and the high sensitivity (HS) assay. The limit of detection is defined as the mean of the control measurement (c G‐CSF = 0 ng mL−1) plus three times the standard deviation of the control. d) Comparison of the detection antibody from the two different suppliers, both tagged either with SAPE or fluorospheres from TF. e) Final calibration curve for G‐CSF used for the quantification of the G‐CSF production of CTCs with reduced variation and a low detection limit of 1.5 ng mL−1, corresponding to ≈3700 molecules per chamber. (N refers to the number of different microfluidic chips used for obtaining data from n different chambers per chip).