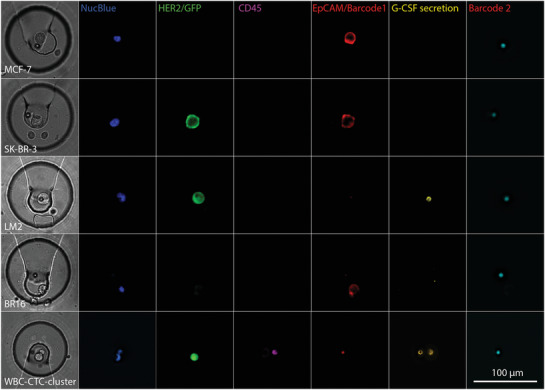
Figure 4.

Brightfield (first column) and fluorescence images of the trapping site, occupied by individual cells of the investigated cell lines, and for comparison, a trapped WBC (bottom row). The pseudo‐colored fluorescent images reveal the presence of a nucleated cell (NucBlue) and the presence or absence of the membrane proteins HER‐2, CD45, EpCAM as well as G‐CSF secretion captured on the magnetic bead. The bead is identified by its fluorescence ratio at 658 nm (barcode 1)/712 nm (barcode 2).
